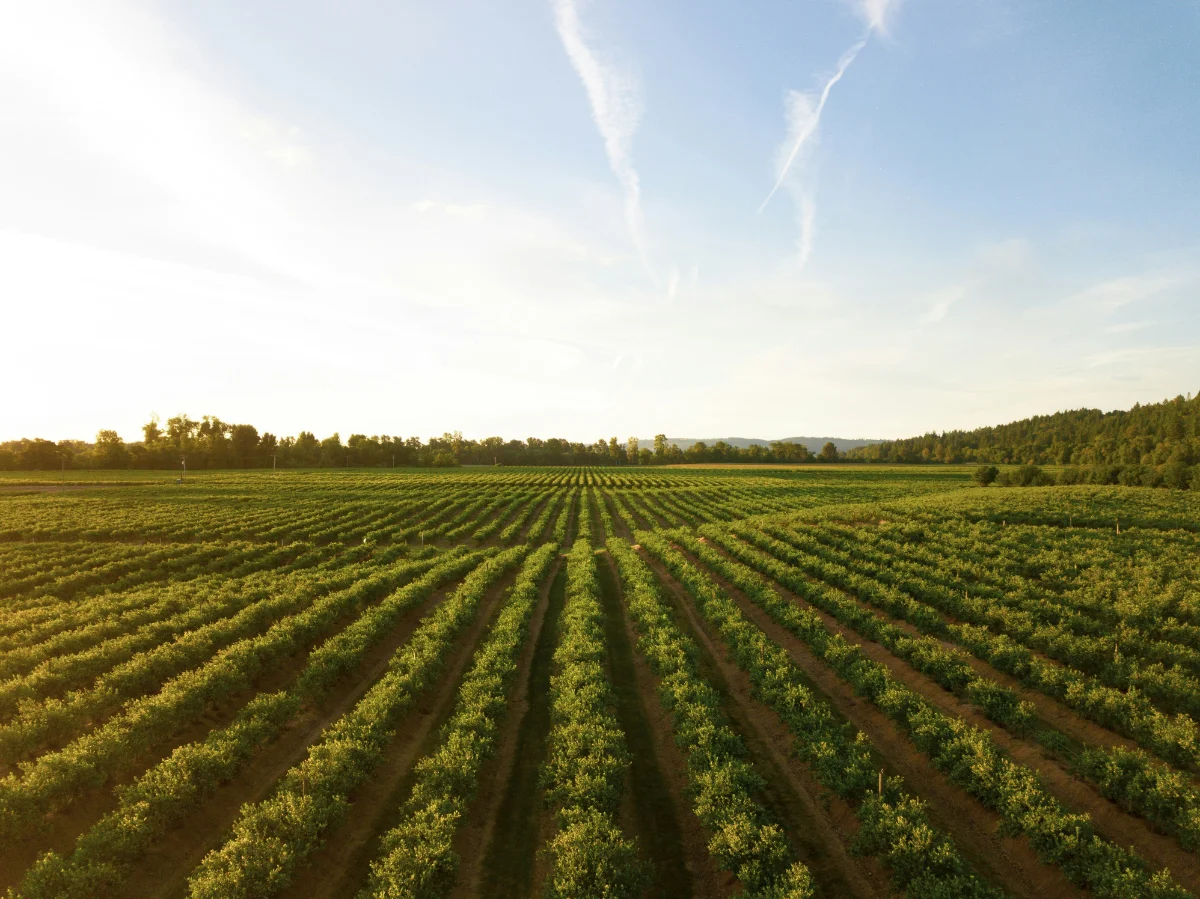
MI DigitalFarm turns several seasons of yield data into stability zones and sub-field profitability, so growers, retailers, and extension educators can put inputs where they actually earn a return.
The platform exists to help different stakeholders — from farmers to retailers to extension educators — understand where digital agriculture can improve profitability and resource-use efficiency while reducing environmental impact.
Rather than a single field-average number, MI DigitalFarm looks inside the field. It combines several seasons of yield data to find the parts of a field that consistently perform — and the parts that don't — then attaches an economic value to each. The same map can be read as agronomy or as dollars, which is usually where the conversation between a grower and an advisor actually happens.
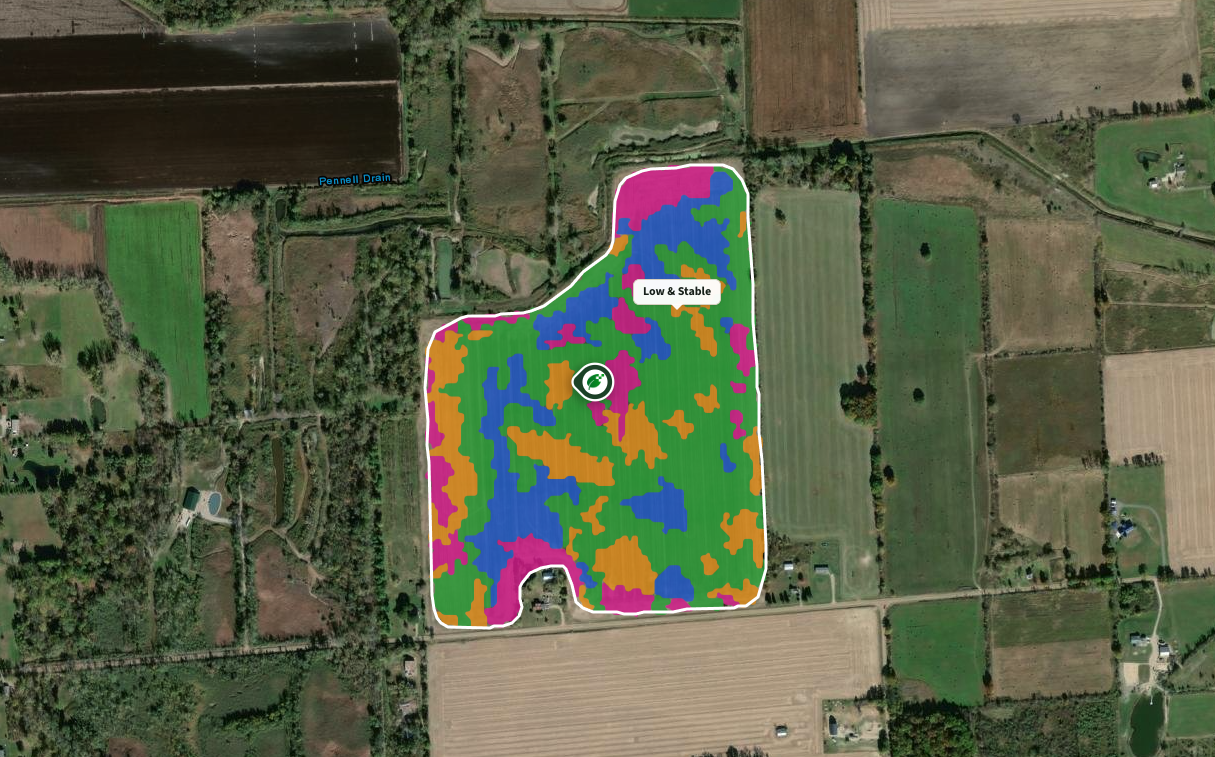
Stability is a powerful concept that uses plants as sensors.
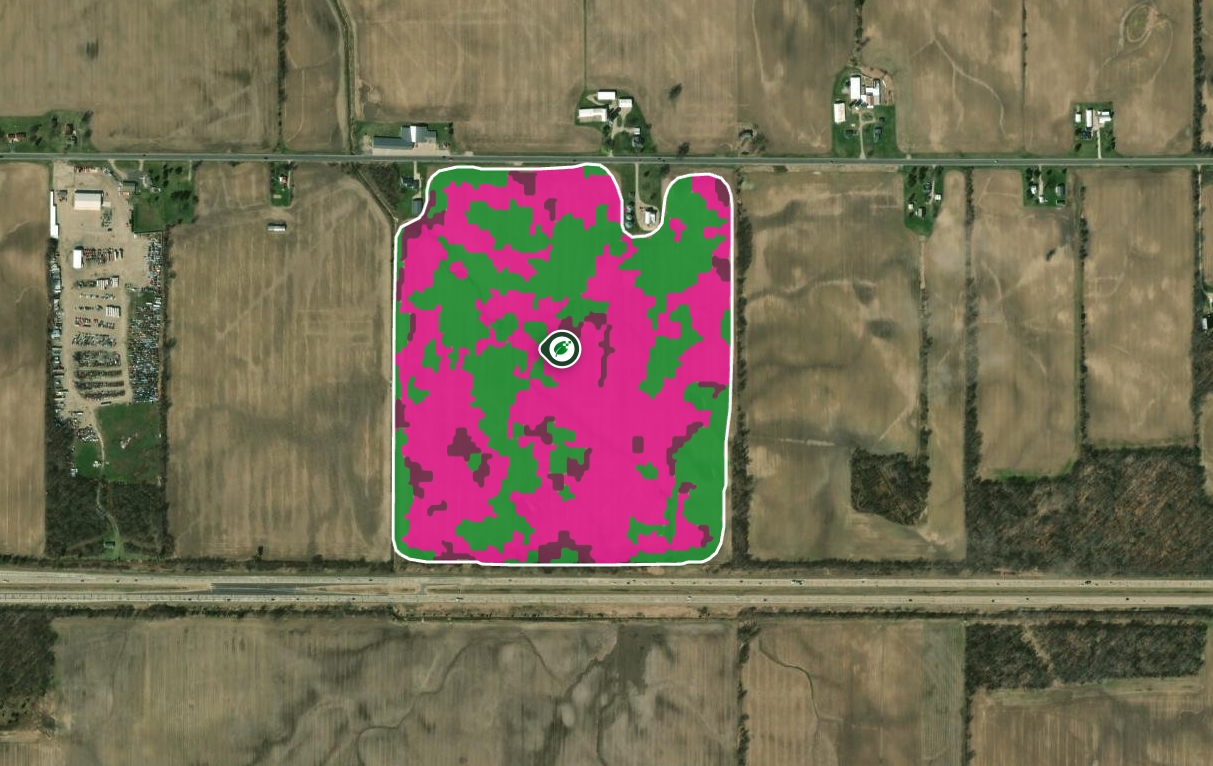
The stability map shows zones within the field, categorized based on their performance — from satellite-derived crop vigor or historical yields.
The zones are classified by their relative production — low, medium, and high — and how consistent that behavior remains over time: stable vs. unstable.
Stability maps have proven to help farmers make better decisions — reducing inputs where they aren't helpful and increasing profitability.
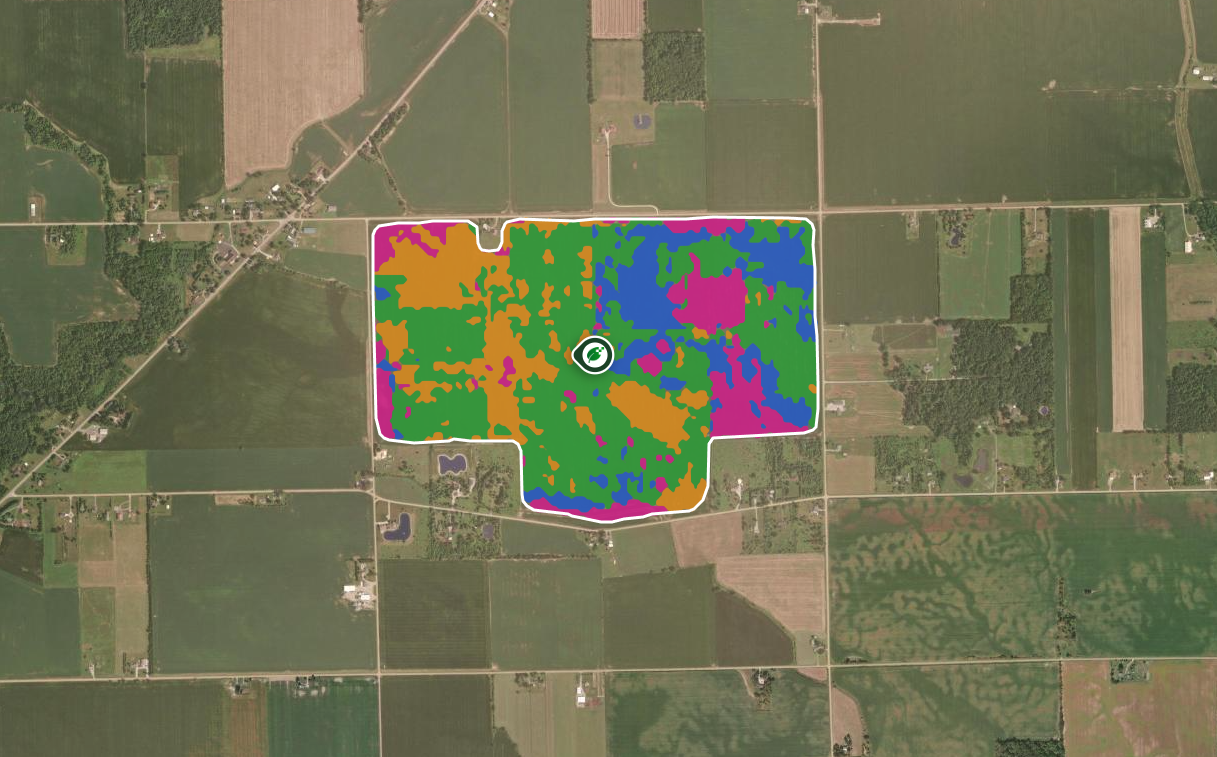
Shares shown for the Ingham Home Quarter preview field.
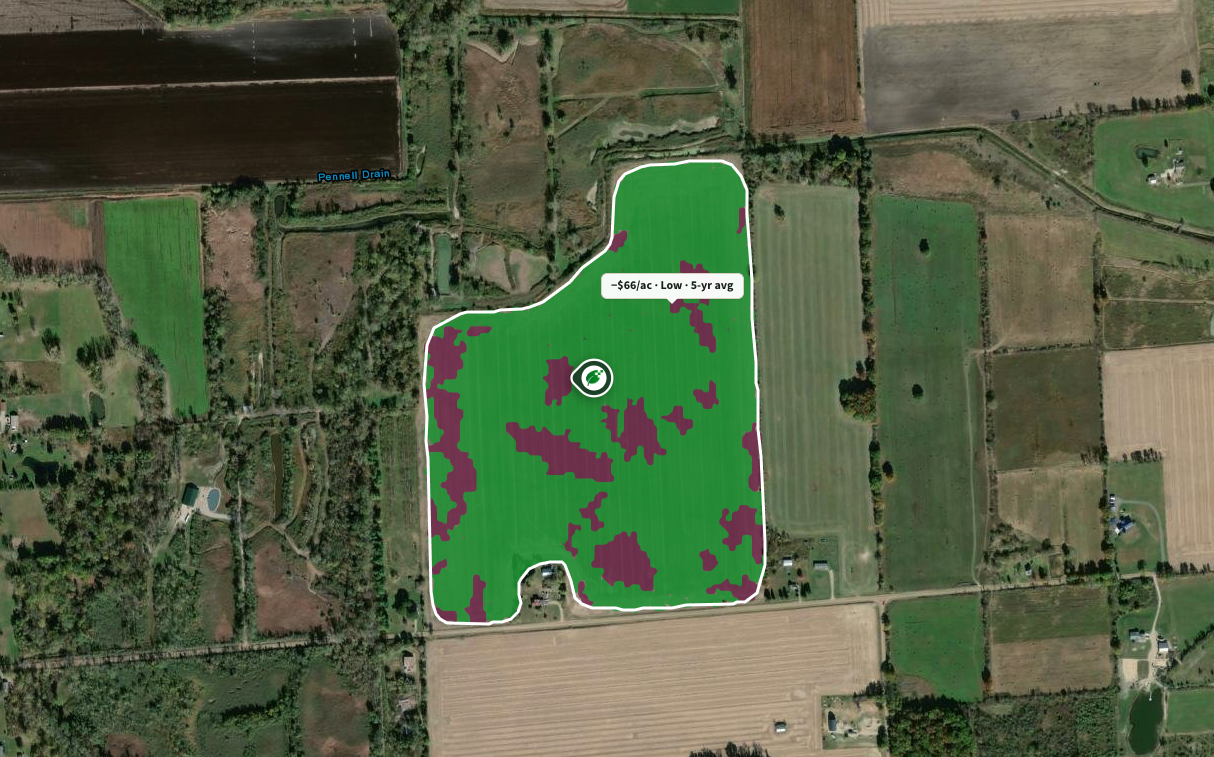
Profit is the difference between crop revenue and input costs.
Profitability is presented in two categories: positive (net gain) and negative (net loss).
The yields are obtained from validated SALUS simulations. SALUS is a crop model that simulates the growth of the plant and the interactions between soil, weather, management, and genetics.
To learn more about SALUS, explore our book chapter and visit the Basso Lab SALUS page.
Drop a pin on the map, name it, and add it to your farm. The preview lets you keep up to three.